Mapping vertical land motion across the New York City area, researchers found the land sinking (indicated in blue) by about 0.06 inches (1.6 millimeters) per year on average. They also detected modest uplift (shown in red) in Queens and Brooklyn. White dotted lines indicate county/borough borders. Credit: NASA/JPL-Caltech/Rutgers University

Localized Uplift, Widespread Subsidence, and Implications for Sea Level Rise in NYC Metro Region

mdrews2023

Mapping vertical land motion across the New York City area, researchers found the land sinking (indicated in blue) by about 0.06 inches (1.6 millimeters) per year on average. They also detected modest uplift (shown in red) in Queens and Brooklyn. White dotted lines indicate county/borough borders. Credit: NASA/JPL-Caltech/Rutgers University

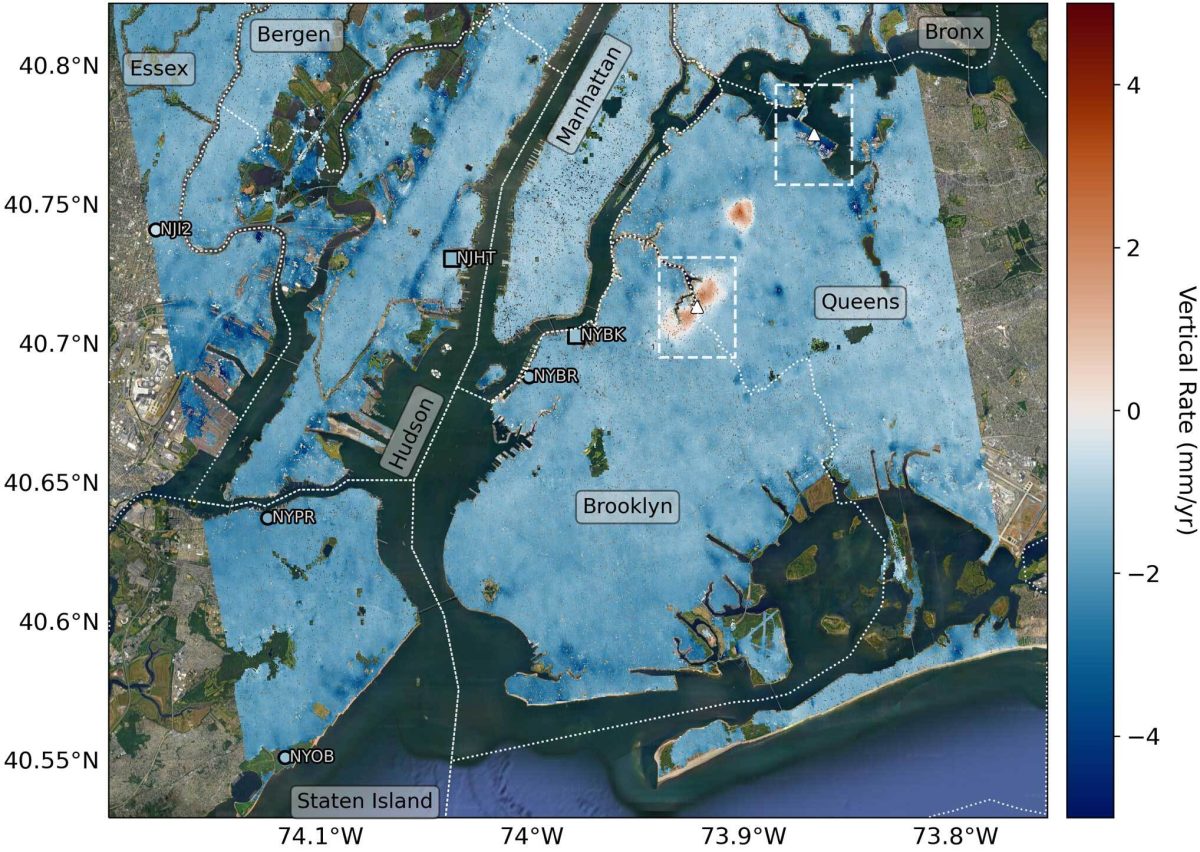
Researchers from NASA’s Jet Propulsion Laboratory and Rutgers University, including RCEI Affiliates Ken Miller and Robert Kopp, have published a new study in Science Advances finding that parts of the New York City metropolitan area are sinking and rising at different rates due to various man-made and natural factors which can mitigate or enhance local flood risk associated with sea level rise and therefore have implications for resilience planning. The study analyzed uplift and subsidence across the metropolitan area using a remote sensing technique called interferometric synthetic aperture radar (InSAR).“I’m intrigued by the potential of using high-resolution InSAR to measure these kinds of relatively short-lived environmental modifications associated with uplift,” Kopp said.

Read More