Rutgers Climate Symposium 2017
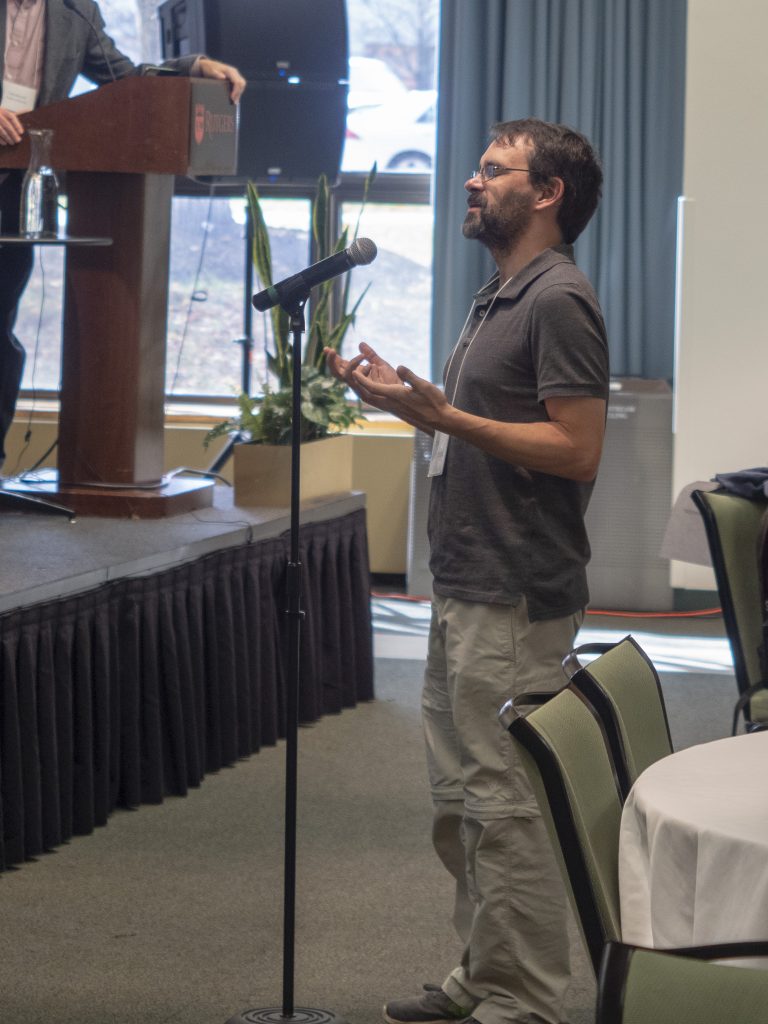
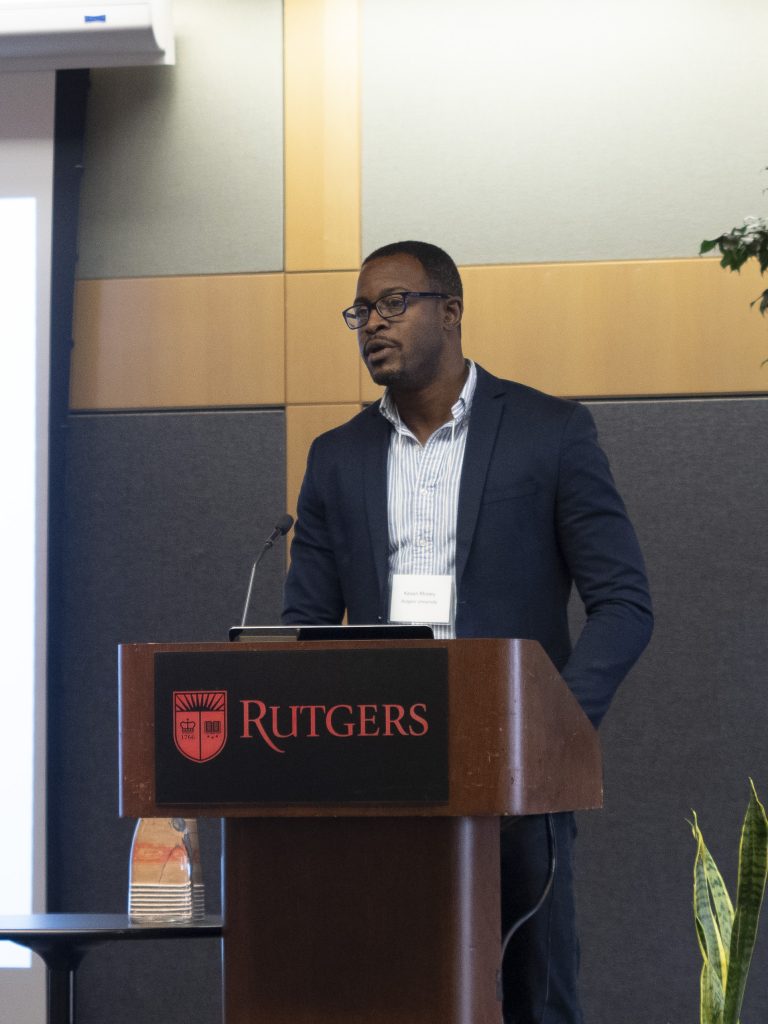
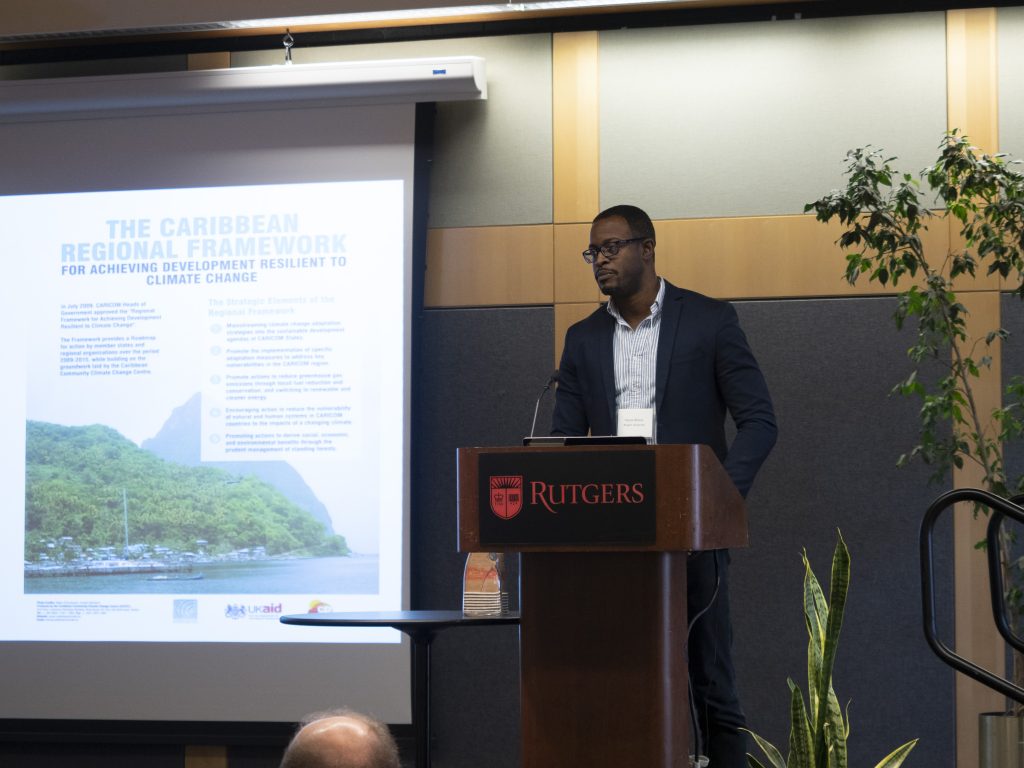
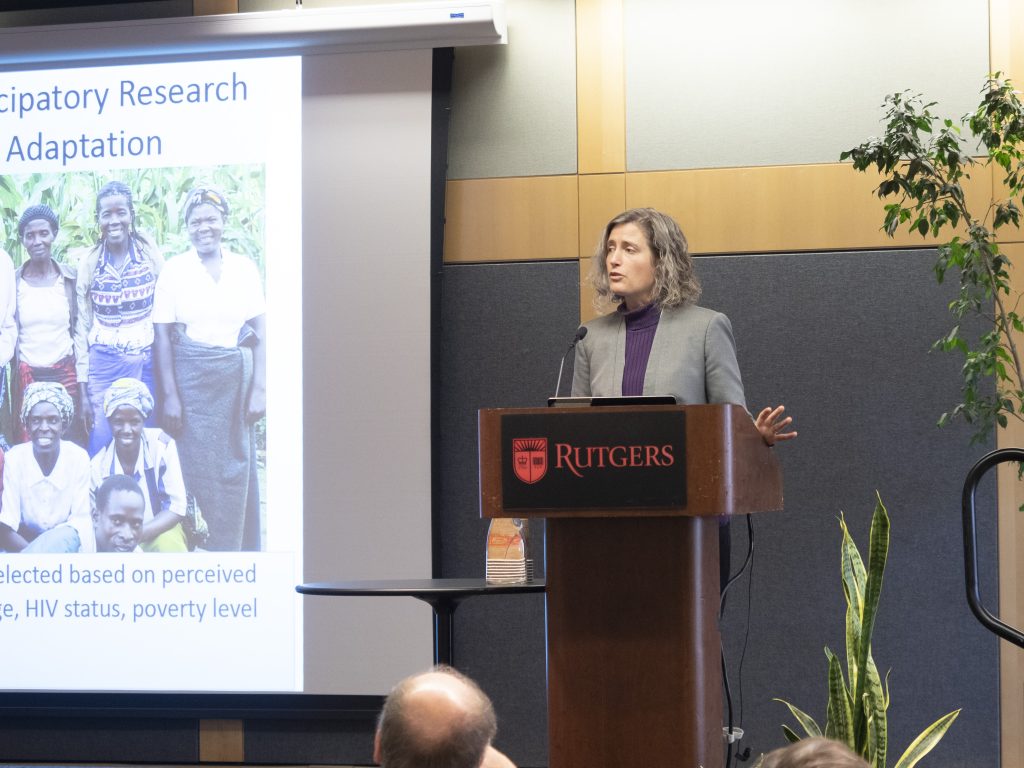
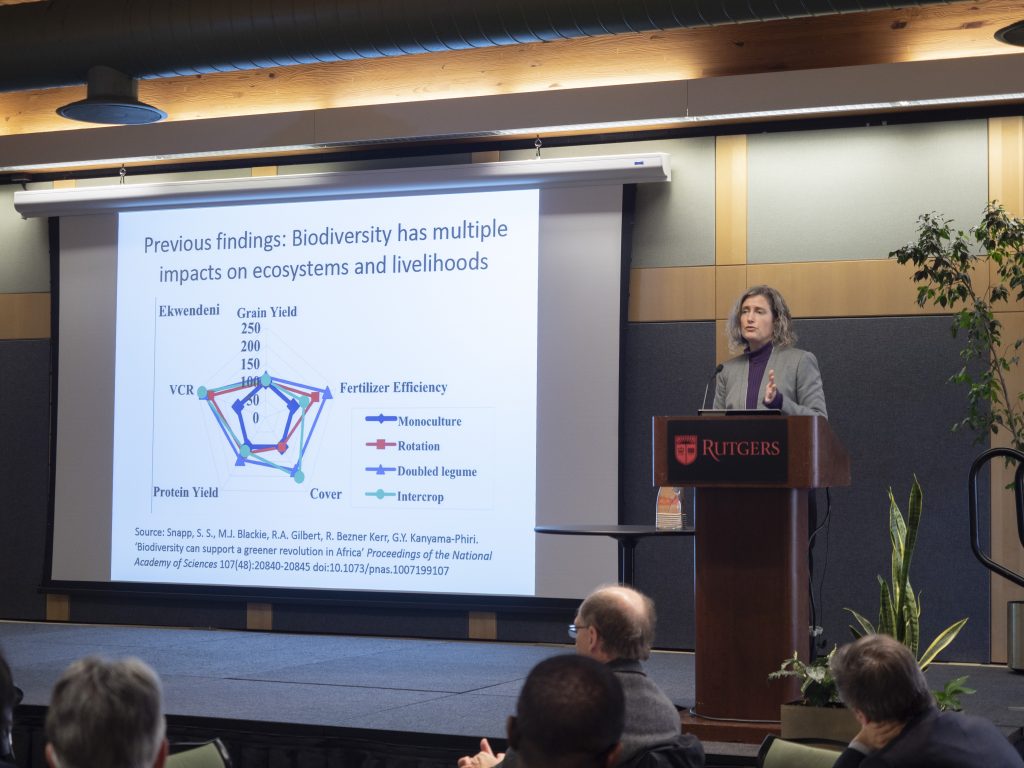
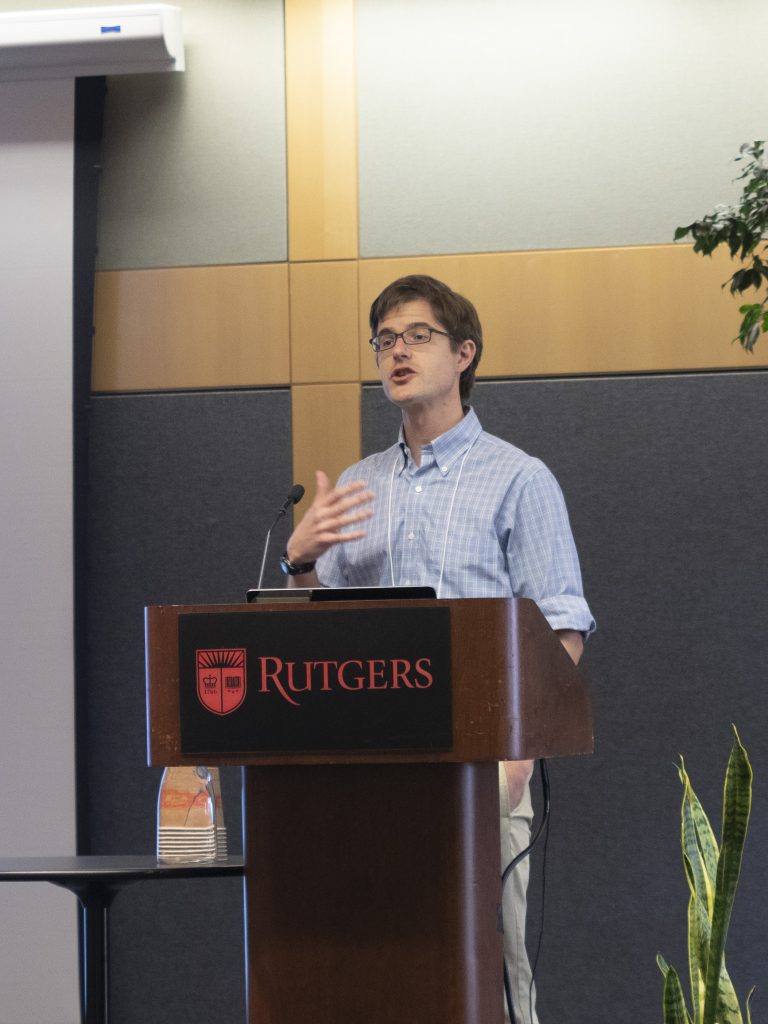
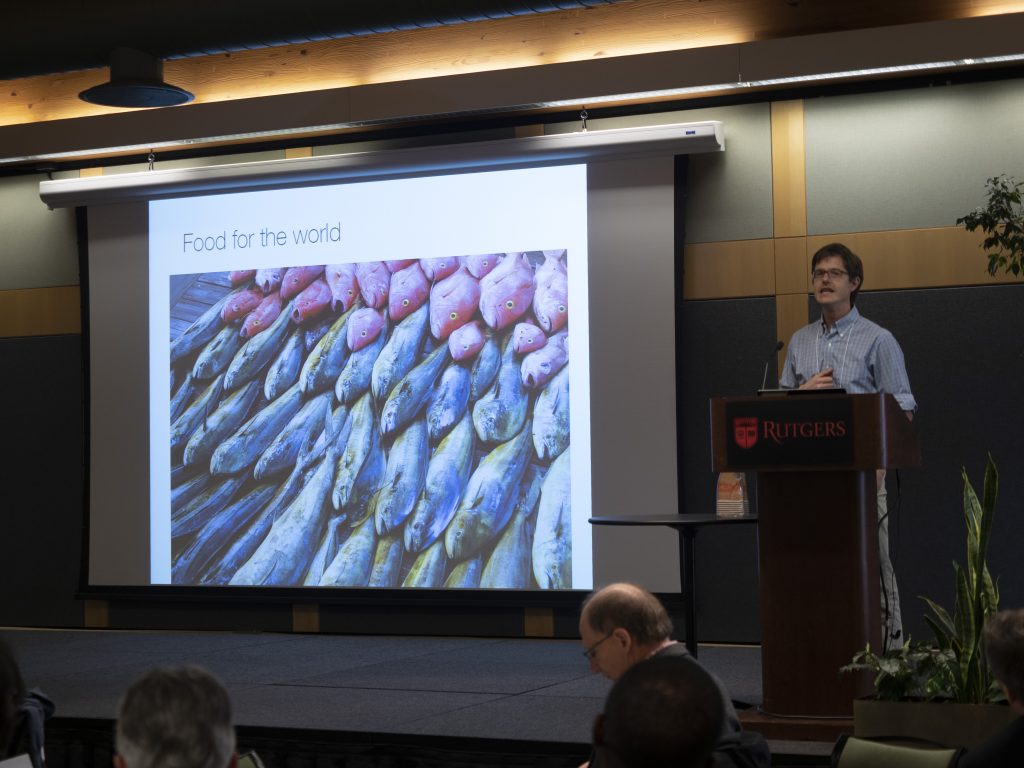
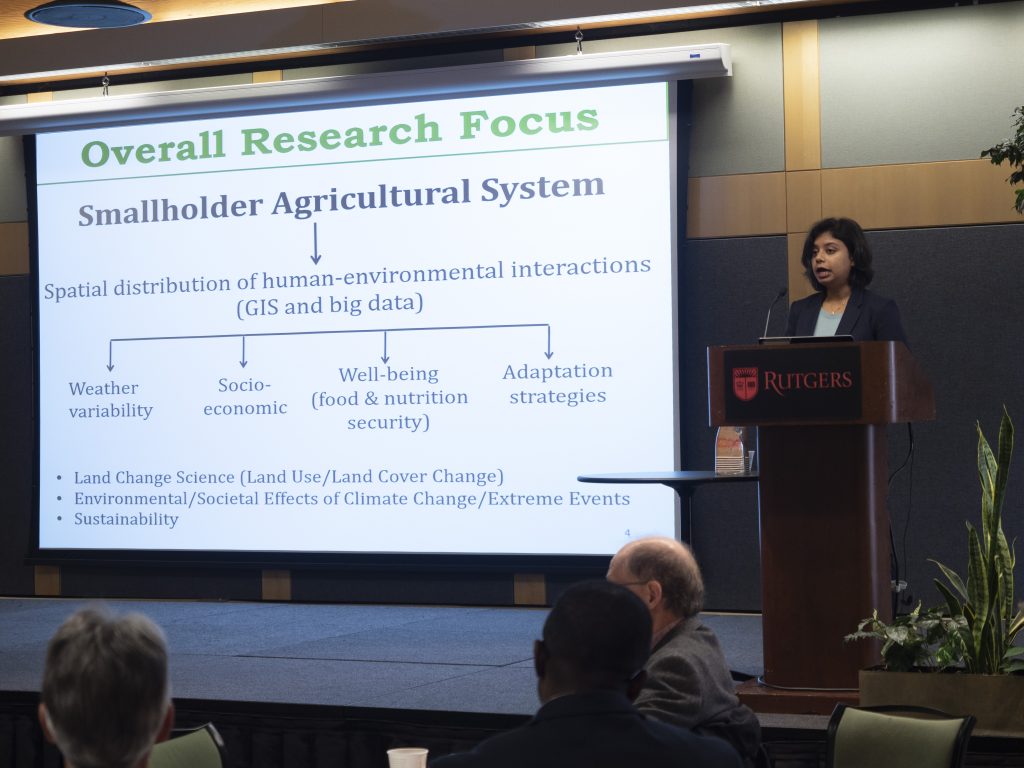
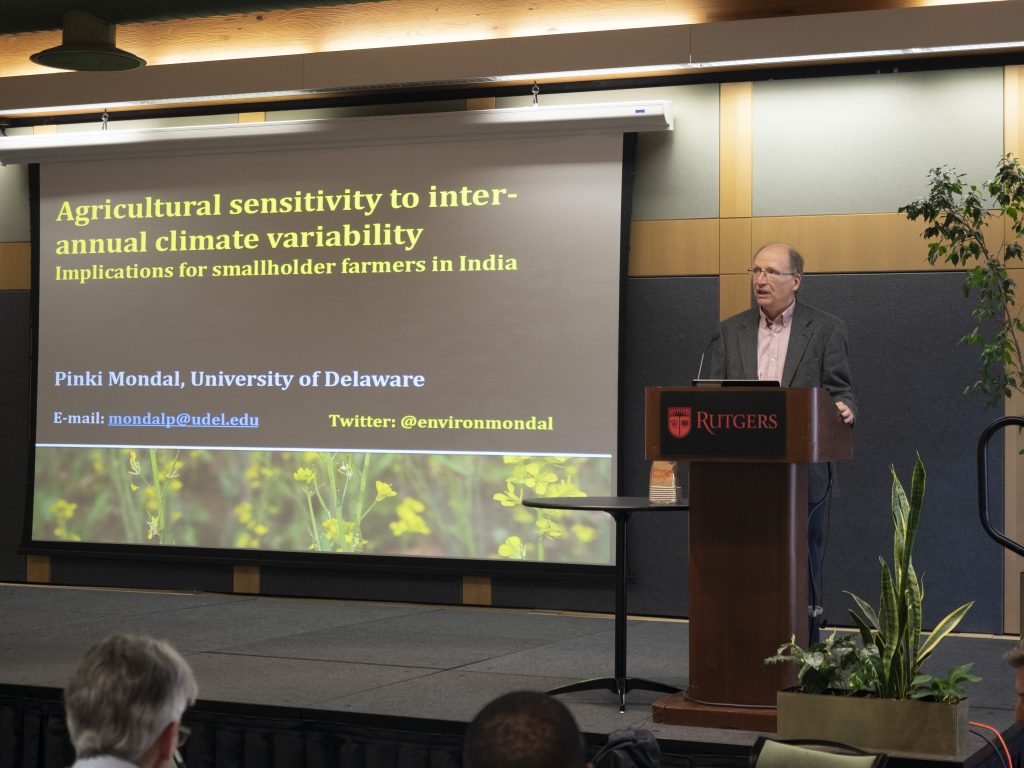
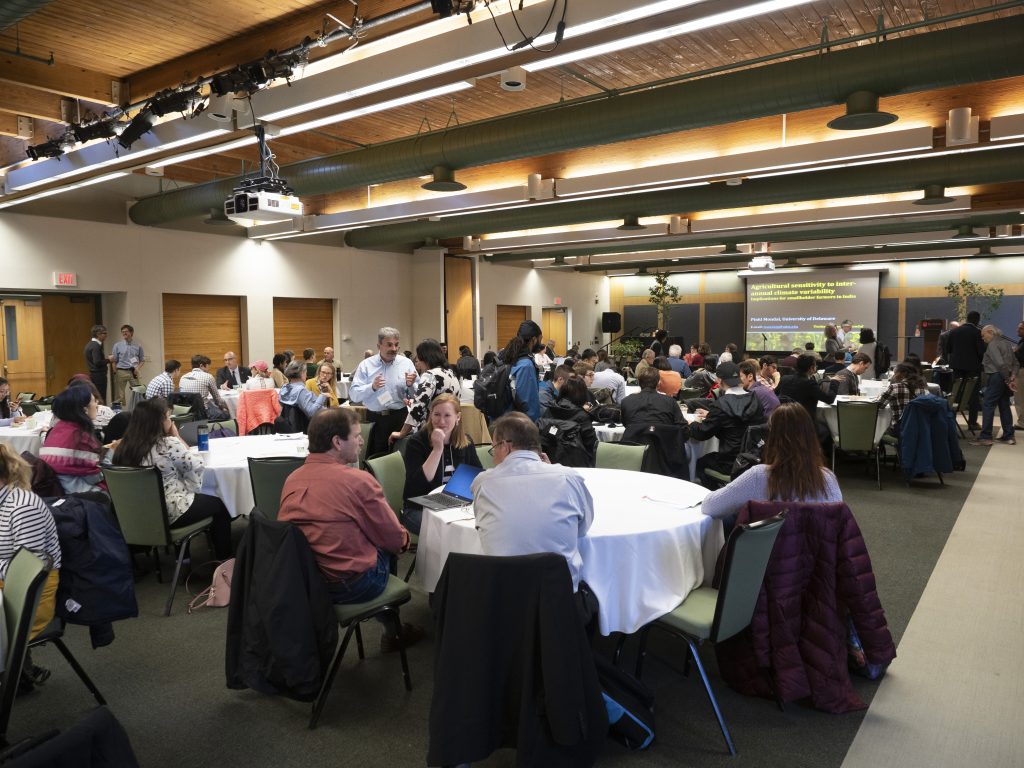
On November 15th, Almost 200 students, post-docs, faculty and staff from academic institutions in our region participated in Rutgers Climate Symposium 2017 in which the theme was Climate Change and Cities. The tag line, "Wherever the world is going cities will get there first" is a nod to the slogan "Wherever American cities are going, Newark will get there first" touted by then Newark mayor, Kenneth Gibson almost 40 years ago. Participants were treated to an inspiring keynote by Rutgers alum, Dr. Cynthia Rosenzweig,of NASA Goddard Institute for Space Studies where she heads the Climate Impacts Group. Dr. Rosenzweig stressed how key cities are to the responding to climate change in terms of both reducing carbon emissions as well as adapting to climate change. She noted that the Paris Climate Agreement recognizes cities as important stakeholders in achieving climate action in agreeing to promote regional and international cooperation. She pointed out that more than 7,100 cities from 119 countries participate in the global covenant of mayors for climate change representing 8% of the world's population and that cities have more direct contact and day to day responsibility for taking governance action to address climate change.
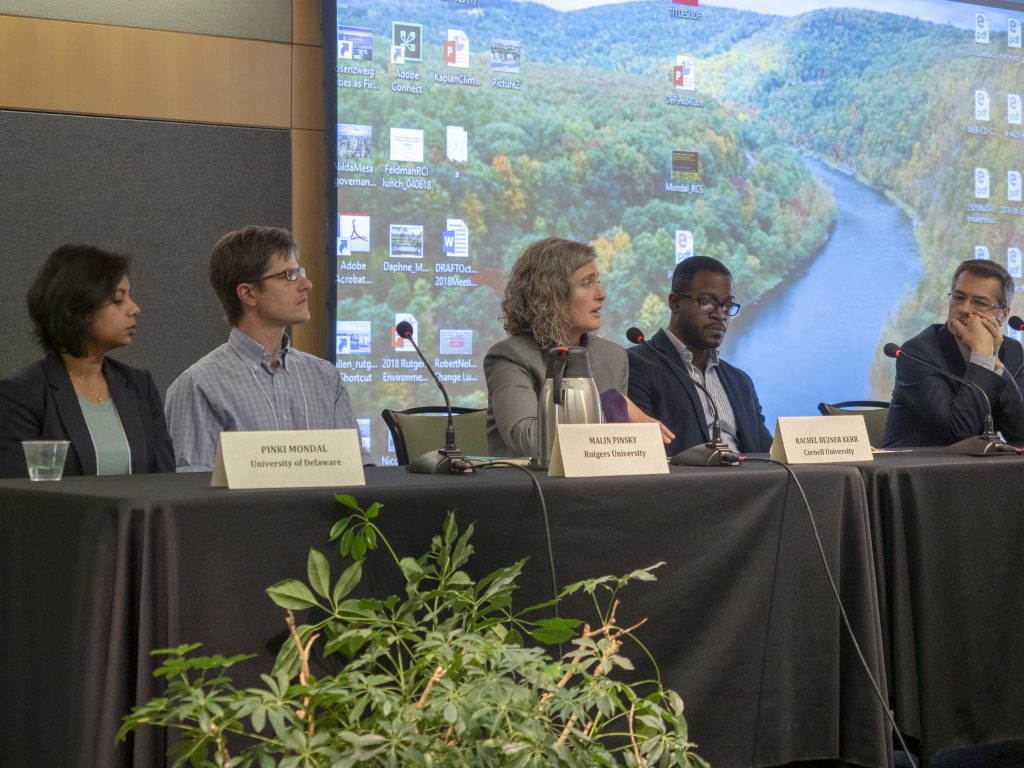
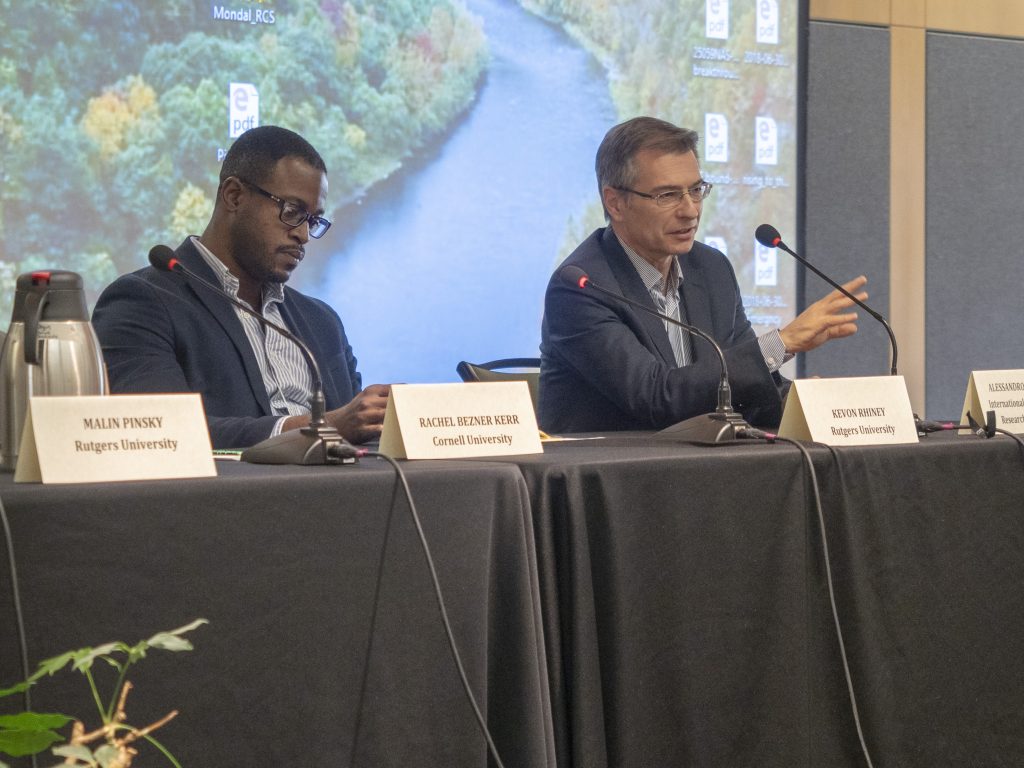
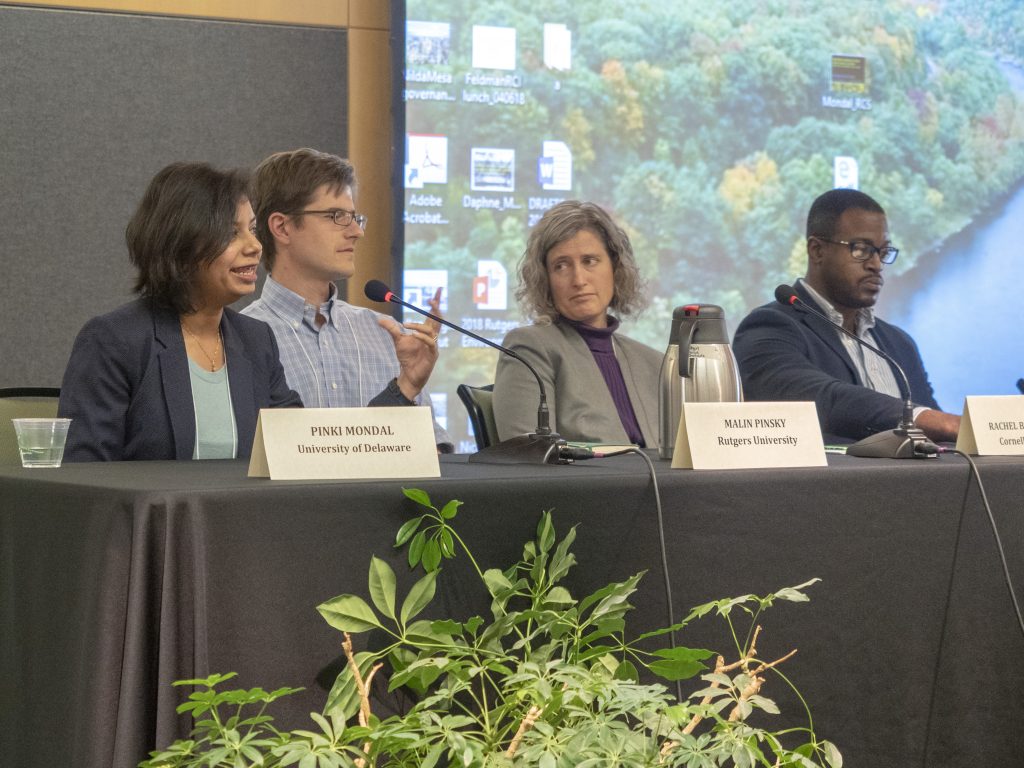
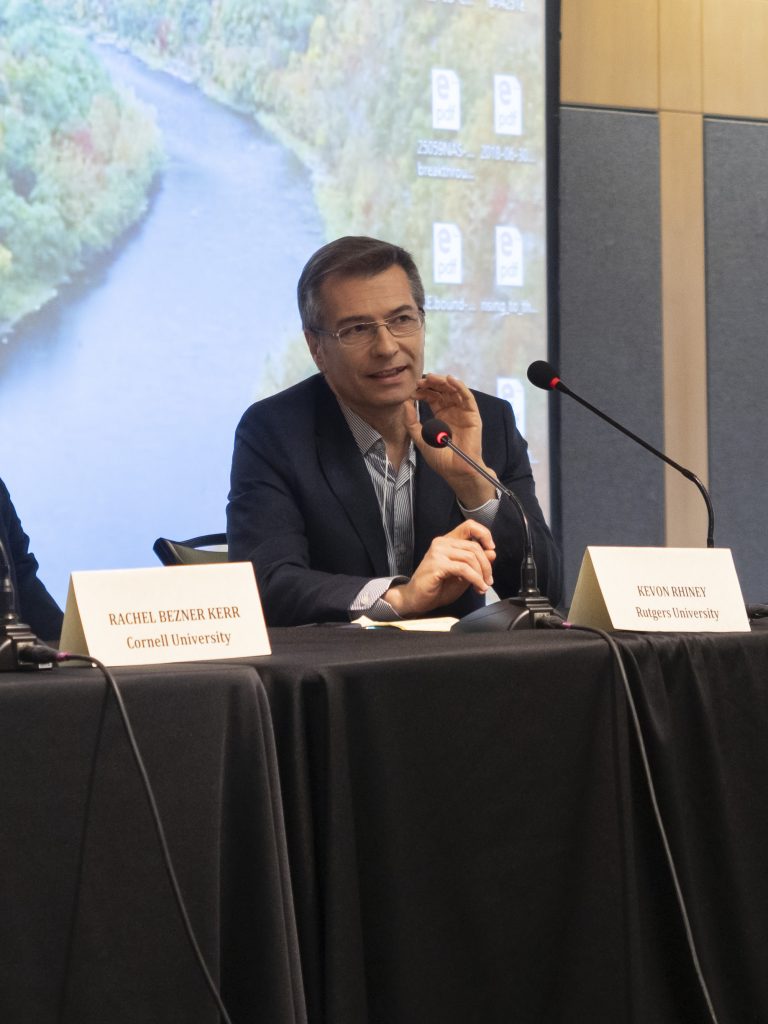
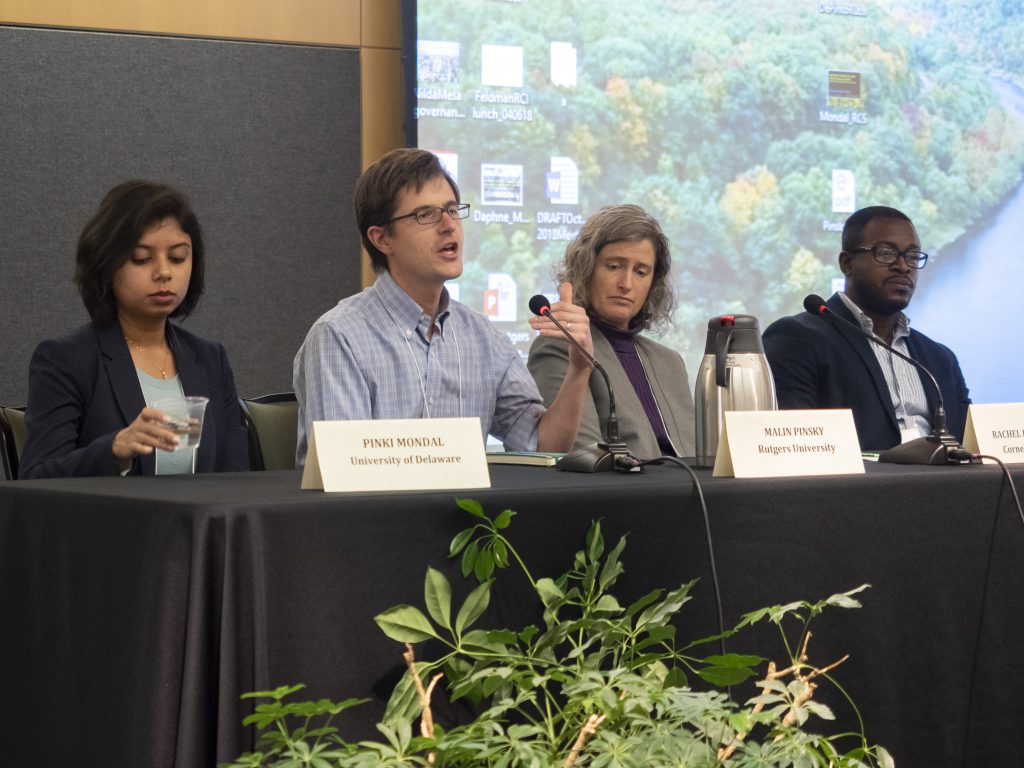
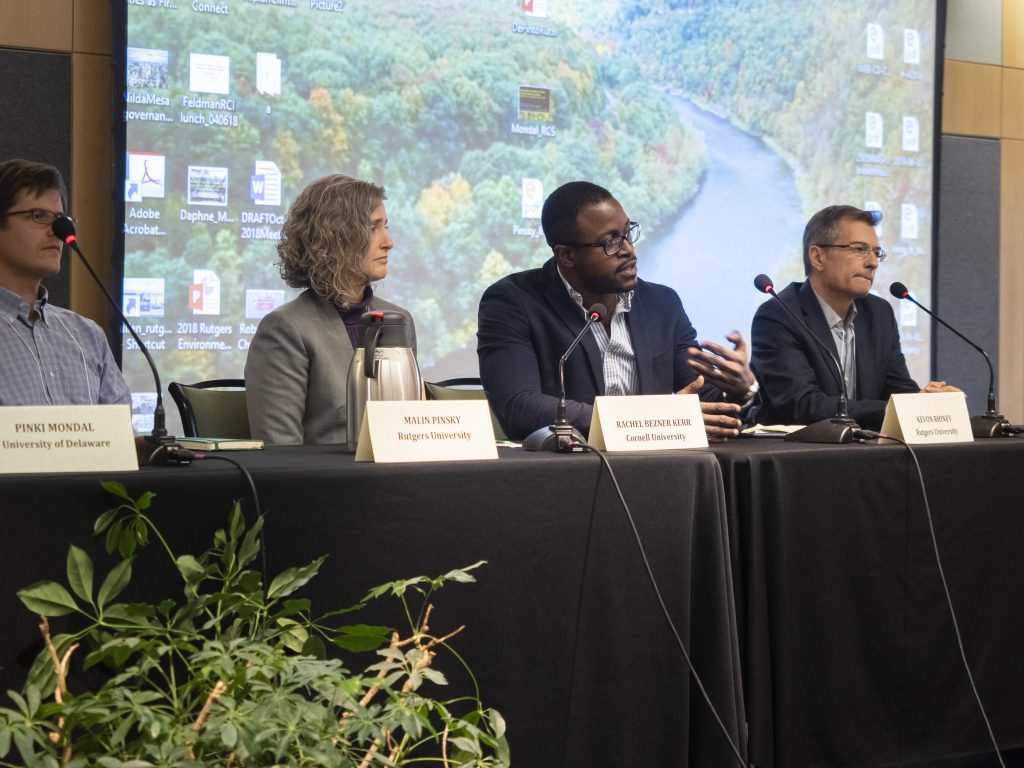
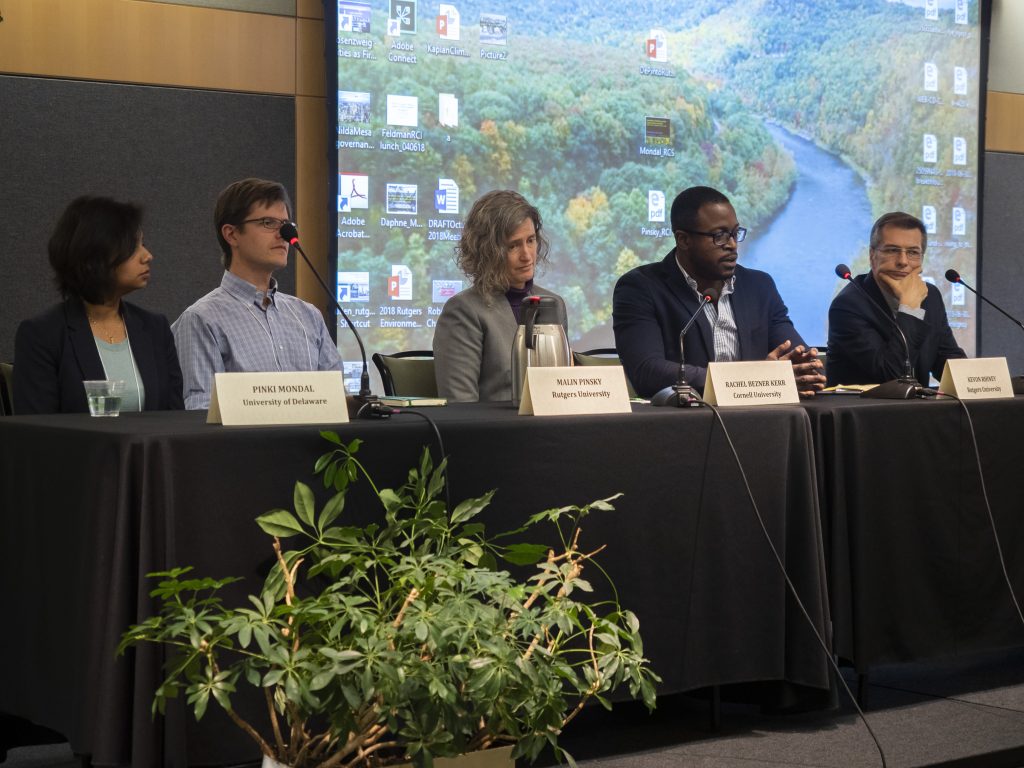
A plenary panel included Nilda Mesa, Director of Urban Sustainability and Equity Planning, Earth Institute, Urban Design Lab, Columbia University; Julie Pullen, Associate Professor of Civil, Environmental and Ocean Engineering, Stevens Institute of Technology and William Solecki, Professor of Geography, Hunter College. In addition to their presentations, the plenary panelists discussed the exciting opportunities for transdisciplinary collaborations between natural and social scientists, noting however, that different disciplines use distinct terminology so that when working across disciplines, collaborators need to ensure they are using common terms. In addition, the panelists discussed the importance of testing assumptions with field work and understanding the culture of a place to inform policy decisions.
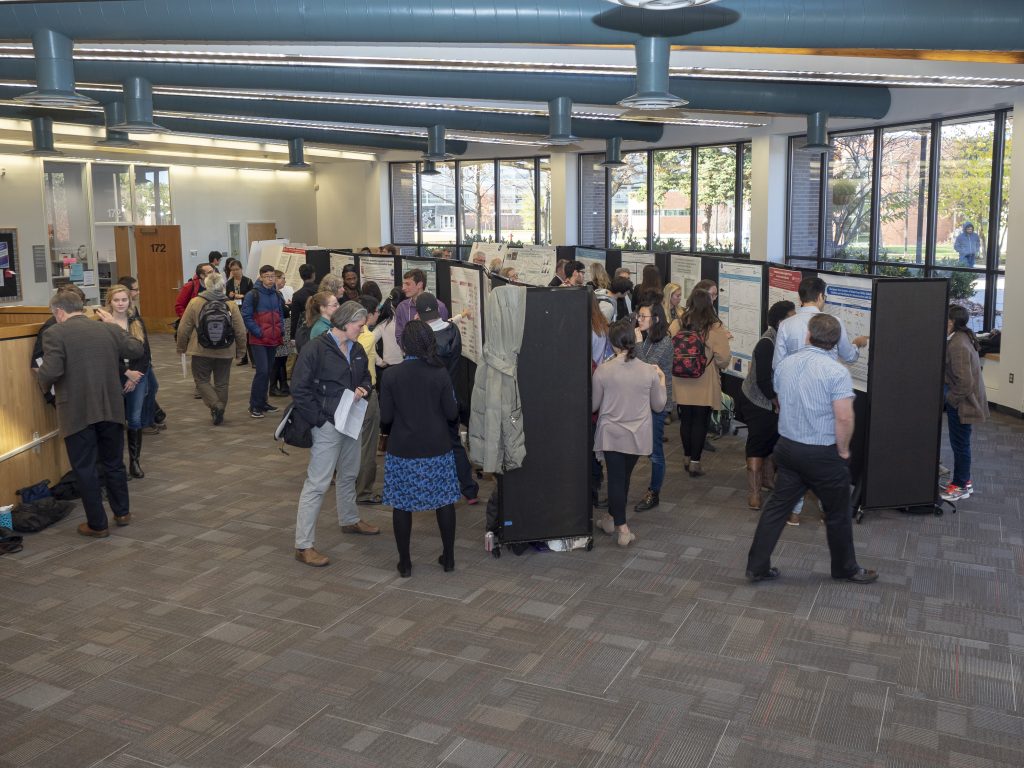
Posters were presented by researchers from not only Rutgers but institutions across the region . The event provided an excellent opportunity to foster collaboration on climate change scholarship in our region.
Rutgers Climate Symposium 2017
Climate Change and Cities
November 15, 2017
AGENDA
8:15 AM Check-In
Poster Session Set-up
Light Breakfast
9:00 AM Welcome and Keynote Address
Executive Dean Robert Goodman, School of Environmental & Biological Sciences
Cities as First Responders to Climate Change | Presentation PDF
Cynthia Rosenzweig, NASA Goddard Institute for Space Studies
10:15 AM Break
10:45 AM Climate Change and Cities Plenary Panel
Moving Vulnerable Communities From Striving to Thriving
Mustafa Santiago Ali, Hip Hop Caucus*
(Mr. Ali was unable to attend.)
Urban Climate Governance and Dynamics | Presentation PDF
Nilda Mesa, Columbia University
The Sea, Cities and Rivers: Living at the Edge | Presentation PDF
Julie Pullen, Stevens Institute of Technology
Extreme Climate Events and Enhancing Opportunities For Risk Management and Climate Resiliency | Presentation PDF
William Solecki, Hunter College-CUNY
12:30 PM Lunch
1:00 PM Poster Session
3:00 PM Adjourn
Rutgers Climate Symposium is made possible through the generous support of the
Frank Sposato Memorial Endowment

Nilda Mesa
Mesa has been the Director of the New York City Mayor’s Office of Sustainability, where she led OneNYC, the city’s path-breaking long-term sustainability plan, overseeing environmental reviews and citywide policy development and implementation on such areas as energy, climate change, green building standards, recycling and the circular economy, environmental justice, air quality, water, parks and natural resources, and sustainable transportation.

Julie Pullen
Dr. Pullen is an Associate Professor in Civil, Environmental, and Ocean Engineering at Stevens Institute of Technology. She holds a joint appointment with Brookhaven National Laboratory and is an adjunct research scientist at Columbia’s Lamont-Doherty Earth Observatory. Previously, she was the Director of the Department of Homeland Security (DHS) National Center of Excellence in Maritime Security at Stevens and a former science fellow at Stanford’s Center for International Security and Cooperation. She studies complex coastal air/sea interactions, those surrounding cities and mountains, utilizing high-resolution (<5 km) coupled ocean/atmosphere/ hydrology models and observations from targeted field campaigns around the globe. Dr. Pullen has served on the steering team for field studies in urban air contaminant dispersion (DHS/Defense Threat Reduction Agency NYC Urban Dispersion Program) and tropical meteorology and oceanography (Office of Naval Research, PhilEx and PISTON programs). Dr. Pullen’s research contributes to the understanding and development of resilience and sustainability in coastal environments, and the enhancement of Earth System Models on weather, subseasonal-to-seasonal, and climate timescales.
In 2015 Dr. Pullen was elected as the physical oceanography councilor for The Oceanography Society. She was a member of the 2014-2016 National Research Council committee on Earth System Prediction and is on the international GODAE Coastal Ocean and Shelf Seas Task Team. Dr. Pullen is a board member of the Waterfront Alliance, a civic organization representing over 900 groups with a stake in the NY/NJ waterfront, and is co-chair of the policy committee. She was a chapter co-author of the 2015 New York City Panel on Climate Change (NPCC2) report. She is currently co-editing an issue of the journal Oceanography focused on ocean warming.
Dr. Pullen holds a master’s degree in applied mathematics from the University of Arizona, and a Ph.D. in physical oceanography from Oregon State University. As an undergraduate at Macalester College she majored in physics and math. She was the first undergraduate intern at the Santa Fe Institute, and conducted postdoctoral work with the Naval Research Laboratory pioneering air/sea coupled modeling.

Cynthia Rosenzweig
Cynthia Rosenzweig is a Senior Research Scientist at the NASA Goddard Institute for Space Studies, where she heads the Climate Impacts Group. She is Co-Chair of the New York City Panel on Climate Change (NPCC), a body of experts convened by the mayor to advise the city on adaptation for its critical infrastructure. She co-led the Metropolitan East Coast Regional Assessment of the U.S. National Assessment of the Potential Consequences of Climate Variability and Change, sponsored by the U.S. Global Change Research Program. She was a Coordinating Lead Author of Working Group II for the Fourth Assessment Report of the Intergovernmental Panel on Climate Change (IPCC). She is Co-Director of the Urban Climate Change Research Network (UCCRN), Co-Editor of the First and Second UCCRN Assessment Reports on Climate Change and Cities (ARC3), and Co-Chair of the Urban Thematic Group for the United Nations UN Sustainable Development Solutions Network (SDSN) and the Campaign for an Urban Sustainability Development Goal (SDG).
She serves as Chair of the Board of the New York City Climate Museum. She was named as one of “Nature’s 10: Ten People Who Mattered in 2012” by the journal Nature, for her work preparing New York City for climate extremes and change. A recipient of a Guggenheim Fellowship, she joins impact models with climate models to project future outcomes of both land-based and urban systems under altered climate conditions. She is a Professor at Barnard College and a Senior Research Scientist at The Earth Institute at Columbia University.

William Solecki
Solecki’s research focuses on urban environmental change, resilience, and environmental transitions. He has served as leader or co-leader of several climate impacts studies in the greater New York and New Jersey region, including the New York City on Panel on Climate Change (NPCC) and the New York State ClimAID report. He currently serves as the co-PI on the Climate Change Risk in the Urban Northeast (CCRUN) NOAA-funded RISA project which is designed to promote climate risk information for decision-makers and stakeholders in the urban Northeast US. Solecki is the participant on a recently NSF funded, Urban Resilience and Extreme Events (UrEX) Sustainability Research Network.
He currently is a coordinating lead author of the IPCC, 1.5°C Special Report, and a lead author on the fourth U.S. National Climate Assessment (NCA4), Northeast Chapter. He is a co-founder of the Urban Climate Change Research Network (UCCRN) and co-editor of the recent Climate Change and Cities Assessment (ARC3) Report. He also serves as the co-editor of the journals Current Opinion in Environmental Sustainability and the Journal of Extreme Events. His Ph.D. is in Geography from Rutgers University.
| Authors | Title | Abstract | Link to the Poster PDF |
|---|---|---|---|
| Nazia Arbab | Assessing Land Use and Land Cover Change in Highlands, New Jersey | Land use and land cover change (LUCC) is important for understanding socio-ecological system and resilience. Spatial simulation of LUCC system modeling is challenging due to uncertainty and sensitivity of land use change drivers and land use system complexity. In this research, a logisticregression-based (LR) model and artificial-neural-network-based (ANN) model were developed and applied to simulate complex land use change processes and trends in Highlands region of New Jersey. Results indicated that the ANN model was more efficient compared to the LR model in achieving land use change simulation accuracy. Implementing artificial neural network in land use system model helped in capturing the complex relationships between LUCC and a set of spatial land use change driving factors. The two spatially explicit land use system models were reliable and provide the accuracy of land use process. These models also have potential implications for land use planning and sustainable development in highlands, New Jersey. | |
| Tyra Aversa (Rutgers University), Parker Herrera (Rutgers University), Dr. Cara Cuite (Rutgers University), Dr. Rachel Schwom (Rutgers University) | Challenges of Categorizing Household Food Items and Understanding Climate Impacts | Rutgers collaborated on a project whose goals are to analyze household-level food, energy, and water consumption and to establish interventions to reduce consumption. Within this larger project, our specific research aims to create a way to collect and record grocery receipts from households and to have food listed in their respective categories in order to link food purchases to greenhouse gas emissions. While energy and water can be tracked with electronic meters, collecting food data can be done through several methods, many of which involving significant burden on the participant or researcher. Challenges in categorizing foods are that they fit into different categories depending on how they are processed or packaged; technology like an optical character recognition (OCR) reader that could read scanned receipts, does not work; and participants categorizing the foods themselves leads to mistakes. Our solution: have participants scan pictures of the receipts, upload them to a website, and have trained individuals categorize the items using a computer program to ensure uniform data entry. We hope this will give us an understanding how to better collect household food consumption data and will allow more researchers to target the issue of household food consumption and climate change mitigation. | |
| Ariel Avgi (NOAA-CREST at The City College of New York), Ehsan Najafi (The City College of New York), Indrani Pal (NOAA-CREST at The City University of New York)) | Characterizing Concurrent Hot and Dry Spell Events Across Crucial Breadbasket Regions | Extreme hot and dry spells in major growing regions have far reaching impacts on global food production. Observed data suggests that there has been a substantial increase in the number of concurrent droughts and heatwaves over the last fifty years—conditions that prove devastating for crop growth. This study assesses the incidence of concurrent extreme droughts and heatwaves on wheat croplands across the major breadbasket regions around the world between 1950 and 2014. Maps were produced for spring and winter growing seasons, which represent the global distribution of wheat croplands in the years that experienced the greatest number of concurrent extreme events during the history of the available data (e.g. gridded daily surface temperature, SPEI and PDSI). By assessing the global distribution of wheat producing locations affected by the most extreme incidents of concurrent hot and dry spell conditions, we aim to present a better diagnosis of (1) the characteristics of extreme weather conditions relevant for global wheat productivity around the globe and (2) the associated larger-scale climate variability. | |
| Holly Berman, Rachael Shwom, Cara Cuite | Household Behavior Change Interventions for Climate Change Mitigation: A Typology Targeting the Food-Energy-Water (FEW) Nexus | The purpose of this research is to propose a new typological framework for classifying behavioral interventions for climate change mitigation targeted at the household food, energy, and water nexus to both advance the science of behavioral change beyond specific realms and contexts, and to allow the accumulation of insights on human behavior. This study seeks to review what types of interventions are frequently being utilized in recent FEW consumption research, and how these intervention strategies can be reconceptualized and implemented across research areas with greater ease. Interventions can fall within the categories of information, tailored information, action, gamification, and addressing structural barriers. Recognizing these roles provides one way of linking intervention technique to theoretical behavioral motivators in order to affect climate change mitigation at the household level. | |
| Joanna Burger (Rutgers University, Division of Life Sciences), Michael Gochfeld (Rutgers University, Environmental and Occupational Medicine, RWJ Medical School) | Seabird Population Declines in NJ Reflect Sea Level Rise | Seabirds nesting on low-lying islands are vulnerable to sea level rise and the effects of increased storm frequency and severity. These effects are magnified for coastal islands where human disturbance and development reduce options for nesting. We examined population levels, and colony numbers of Herring, Great Black-backed and Laughing Gulls, Common and Forster’s Terns, and Black Skimmers from 1976 to 2017 in Barnegat Bay, New Jersey. Nesting populations (and the number of colony sites) of all species declined, except for Great Black-backed Gull, which being larger, could outcompete the smaller species for remaining prime nesting sites. Declines in reproductive success lagged behind decreases in number of nesting terns and skimmers. The larger gulls were also predators on the smaller species of gulls and terns. Laughing Gulls declined precipitously following culling at JFK airport, and never regained their former number of nesting pairs. Smaller species were forced into lower elevations, sub-optimal nesting sites, and had lower nesting success due to flooding. Higher frequency and severity of winter storms resulted in loss of wrack high on marshes due to complete over-washing of low-lying islands, which reduced the availability of nest sites for terns and skimmers. The declines in population numbers for colonial-nesting gulls terns and skimmers followed similar loss of habitat and declines in populations of seabirds in Chesapeake Bay to the south, and were earlier than similar declines in Long Island Sound and the NY-NJ harbor. | |
| Ting Cai (EOHSI, Rutgers University), Xiang Ren (EOHSI, Rutgers University), Yong Zhang (EOHSI, Rutgers University), Zhongyuan Mi (EOHSI, Rutgers University), Leonard Bielory (Department of Environmental Sciences, Rutgers University), Panos G. Georgopoulos (EOHSI, Rutgers University) | Assessing impacts of climate change on co-occurring ragweed pollen and ozone exceedances across the contiguous US using an integrative data analysis and predictive modeling framework | Ambient air quality has been substantially impacted by climate change over the past few decades. In fact, climate change critically affects both the atmospheric processes involved in the dynamics of air pollution systems and the dynamics of biogenic emissions, including tree and grass pollens and fungal spores. Furthermore, the prevalence of Allergic Airway Disease (AAD) is growing globally, resulting in increased numbers of emergency department visits and hospitalizations. Clinical studies show that AAD can be exacerbated by the synergistic action of aeroallergens such as pollens and spores, and atmospheric pollutants such as ozone. Previous studies, involving data from nationwide observations of airborne pollen counts of selected plant species in conjunction with climatic factors, indicated that the start date and length of pollen season, the average peak value and the annual total of daily airborne pollen counts have been affected by the changing climate. The present study investigates co-occurrences of ozone exceedance and allergenic pollens across the contiguous United States (ConUS). Analyses of observed pollen counts and ozone concentrations at 58 pollen monitor stations were conducted. Also, emissions and concentrations of pollens in base years (2004) and future years (2047) were simulated with a customized version of CMAQ (the Community Multiscale Air Quality model) employing a grid with 36 km by 36 km horizontal resolution, while corresponding ozone concentrations at the same resolution for the above timeframes were conducted by a multi-university/agency consortium including USEPA. This study employed spatiotemporal correlation analysis to examine patterns of co-occurring ozone and pollen concentrations; the outcomes of this analysis provide information that can support development of strategies for managing health-impacts of co-occurring photochemical pollutants and aeroallergens. | |
| Xi Chen (Department of Earth & Environmental Sciences, Rutgers University, Newark, NJ, USA), Xavier Comas (Department of Geosciences, Florida Atlantic University, Davie, FL, USA), Zhongjie Yu (Department of Geology and Environmental Science, University of Pittsburgh, Pittsburgh, PA, USA), Andrew Reeve (School of Earth and Climate Sciences, University of Maine, Orono, ME, USA), Lee Slater (Department of Earth & Environmental Sciences, Rutgers University, Newark, NJ, USA) | Permeable glacial deposits regulate hydrology and methane emissions in eccentric bogs | Ponds often cluster in an eccentric crescent pattern in bogs that are spatially associated with eskers over northern regions. Eskers and other permeable glacial deposits influence hydrology and may also regulate methane (CH4) emissions in such eccentric bogs. Ground penetrating radar imaging and direct coring confirmed that clustered ponds coincide with esker outcrops in two eccentric bogs in Maine (USA). Chamber-based flux measurements revealed that the mean CH4 flux from peat above permeable lenses of buried esker crests in contact with organic soil in the pond area of one bog (31.12 mg CH4 m-2 day-1) was larger than the mean fluxes far away from the ponds (0.87 mg CH4 m-2 day-1). Transects of hydraulic heads and geochemical data revealed downward water flow from shallow peat soil towards the permeable lenses, suggesting enhanced downward transport of labile organic carbon that presumably accelerates decomposition and CH4 production in deep peat. The high CH4 flux associated with permeable lenses suggests that permeable glacial deposits (such as eskers) might serve as geological proxies of CH4 hotspots in eccentric bogs, where direct CH4 fluxes from the peat add to fluxes from ponds themselves. | |
| Shauna Downs (Rutgers University), Walter Baethgen (IRI, Columbia University), Richard Deckelbaum (IHN, Columbia University) and Madeleine Thomson (IRI, Columbia University) | Climate, food systems and nutrition Climate, food systems and nutrition | There are 821 million people who are undernourished on the planet. Fifty million children under five are wasted and 151 million are stunted, while over 2 billion people have micronutrient deficiencies. Subsistence farmers are among the most vulnerable to the multiple burdens of malnutrition. They are also among the most vulnerable to climate variability, including extreme events. Thus, the objectives of this paper is to: 1) examine the way in which climate affects nutrition using a food systems approach; 2) identify potential ‘nutrition-sensitive’ interventions aimed at adapting to climate variability; and 3) identify entry points for climate services to help improve the implementation of ‘nutrition-sensitive’ climate adaptation interventions. Through an extensive review of the literature we find that although there are many gaps in the existing evidence base, there are several interventions that can be adopted to inject nutrition into climate adaptation approaches. In addition, climate services can play an important role in terms of prioritizing nutrition-sensitive climate adaptation interventions based on spatial and seasonal risk. More specifically, such services can be used to better target interventions, provide early warnings and inform long-term planning and preparedness. | |
| Xiaodong Wang (Changchun Normal University, Changchun, China) and Weihong Fan (Stockton University, Galloway, NJ, USA) | Population Dynamics of Erman's Birch (Betula ermanii) and Climate Change at the Changbai Mountain Treeline, China | In order to understand the mechanisms underlying the population dynamics of ermani's birch in responding to climate change over the past 55 years, 310 quadrats were sampled in 7 plots located in the upper treeline region on the north-facing slopes of Changbai Mountains located in northeastern China. IKONOS images were used to identify the spatial distribution of erman's birch with the aid of a digital elevation model (DEM). Meteorological data were recorded in the field throughout the study area and collected from a nearby long-term weather station, to reconstruct the temperature and precipitation changes. We collected tree-ring samples from a total of 1197 erman’s birch trees and shrubs. The correlation coefficients between 14 climate parameters from 1953 to 2008 and the aggregated annual indices of population dynamics for each of the 310 quadrats in the corresponding years were calculated via statistical analysis facilitated by GIS technology. The results show that population of erman's birch was more sensitive to changes in air temperature than to changes in precipitation. During the period when air temperature increased at a slower pace, its population steadily expanded via asexual reproduction and with a higher survival rate. During the period when air temperature increased rapidly, its population responded via rapid sexual reproduction and produced a large number of progeny. | |
| Subhasis Giri, Nazia N. Arbab, Richard G. Lathrop: Rutgers University | Assessing the Potential Impacts of Climate and Land Use Change on Water Fluxes and Sediment Transport in a Coupled Natural and Human System | Global climate change has potential impact on hydrologic processes. With increase in temperature, climate change is accelerating the global hydrologic cycle. Climate change is projected to cause changes in precipitation pattern which may trigger the changes in watershed hydrologic processes including timing and magnitude of surface runoff, stream discharge, evapotranspiration, and flood events, all of which would influence other environmental variables such as nutrients and sediment flux on water sources affecting every aspect of human life. Apart from climate change, land use is one of the most important components of terrestrial environment that affects surface runoff, stream discharge, and sediment transportation influenced by rainfall interception, evapotranspiration, and surface soil hydraulic conductivity. Land use change impacts associated with deforestation, agricultural transformation, and formation of new urban land on water resources have created social and political problems at both local and national levels. In this study, we have developed an integrated modeling framework in a Coupled Natural and Human system where the natural system was modelled using Soil and Water Assessment Tool (SWAT) and the land use conversion due to human actions was developed using an Agent-based land use conversion framework. The objectives of this study were to i) evaluate the potential impact of climate change in the near future on different components of hydrological cycle as well as sediment generation in the Neshanic River Watershed, ii) comparison of the effect of climate change versus combined effect of climate and land use change on different components of hydrological cycle and sediment loads in the watershed. Results suggested an increasing warmer climate and lesser precipitation in the watershed. The streamflow was projected to increase due to increase in groundwater and lateral flow despite of lesser surface runoff. The sediment transport was projected to decrease compared to base period which may be attributed to reduced precipitation and surface runoff. The trends of hydrological cycle and sediment transport were similar based on climate change alone as well as for combined climate and land use change scenario. | |
| Elgloria Harrison University of the District of Columbia, Jennifer Burton, University of the District of Columbia, Janet Phoenix, MD, George Washington University | Local Community Perspective on Climate Change: Air Pollution & Asthma | The steady rise in temperature has increasingly affected many people worldwide and particularly the elderly, the poor, and the disabled. There is increasing evidence of the impact of elevated temperature on the cardiorespiratory health of humans. It is particularly noteworthy that the World Health Organization (WHO) estimates that 250,000 additional deaths will occur between 2030 and 2050 due to climate change and million more lives will become disabled resulting in a decrease in economical productivity. Asthma and COPD continues to rise in the District of Columbia and it can be argued that the elevation of asthma and COPD cases are linked to changes in the environment (D’Amato et al. 2015; D’Amato et al. 2010). Chronic lung diseases arise from heat and air pollution, and when combined with increased ozone or sulfur dioxide, childhood asthma rates increases (Guarnieri & Balmes, 2014). | |
| Danielle Heaney (Rutgers University) | Designing Protcols that Document Household Food Purchases in an Effort to Reduce Greennhouse Gas Emissions | Although many studies demonstrate the effects of human resource consumption on greenhouse gas emissions, very few examine the consequences of food, water, and energy consumption jointly. The negative effects that over-consuming these resources has on the planet’s ecosystems, biodiversity, and climate change have engendered a need for such research. As part of a national study that aims to develop interventions so individuals can mitigate their energy consumption behaviors, this research specifically focuses on developing a protocol for tracking and categorizing household food intake through food purchases. Purchase price will serve as a measurement-unit in a life-cycle assessment to predict average carbon dioxide emissions for each food category. After examining existing research regarding food data tracking, we chose a combination of survey questions and annotated receipts to measure household food purchases. These methods were deemed less expensive and burdensome than other common methods such as home food inventories (HFIs) and universal product code (UPC) scanning. The outcome of this research was the development of a data collection protocol, including relevant survey questions, food-purchase location categories, annotation schemas, and various flowcharts. Future steps for this study include using the protocol to create a mobile application for eventual use in a national study. | |
| Kaytlynn Knyfd (WPU), Troy Nixon (WPU), Austin Degan (WPU), Jonathan Harris (WPU), Nicole Davi, (WPU / LDEO), Michael Griffiths (WPU), Jordan Raphael (NPS), Jodi Forrester (SUNY ESF) | Tracing Storms and Climate Change Through Tree-Ring Growth Patterns on Coastal Maritime Forests | This project focuses on coastal maritime forests located on Sandy Hook, NJ and Fire Island, NY, in an attempt to understand how local forests have been responding to climate change. Specifically, we aim to examine ring damage in tree cores as a result of severe storm events and saltwater inundation. Due to anthropogenic climate change creating more severe storms and rising sea levels, this study has become increasingly relevant and important in creating necessary foundational research on these unique forests. A series of cores were extracted from four dominant species amongst the two locations. Following sample preparation, we will examine tree-ring width and density using a high resolution scanner and CooRecorder, a computer program used to measure ring width and density. Once the chronologies have been constructed using rigorous cross-dating techniques, we will use the site-specific meteorological data to determine the climate signal. We will also evaluate the oxygen isotopic composition of each ring in several of the older tree specimens to better understand the atmospheric dynamics, and potentially ‘fingerprint’ extreme saltwater intrusion events from major storms. As some of these trees date back to the 1800s, this research will provide extended insights into storm frequency in this region. | |
| Sasha Leidman (Rutgers), Asa Rennermalm (Rutgers), Rohi Muthyala (Rutgers) | Does Sediment Impact the Routing of Meltwater in Supraglacial Streams? | Supraglacial streams are prevalent on the surface of the Greenland Ice Sheet. Water and dark sediment in these streams increase absorption of solar radiation. Their flow variability also plays a significant role in defining the efficiency of the subglacial drainage system. How long it takes meltwater to route through these systems therefore dictates how much they contribute to further melting. Routing times depend on the morphology and bed friction of supraglacial streams. Little is known about the processes that control the amount of friction applied by the bed and how it might be impacted by changes in sediment fluxes. Here we measure a single supraglacial stream in southwest Greenland using high resolution GPS mapping, velocity measurements, and UAV imagery. Analysis of these inputs produced a centimeter scale bathymetric map, a week-long stream discharge time series, and map of initial sediment distribution. Together, they give clues to how sediment changes bed friction through pitting and stream widening. Bed roughness values vary significantly within the study region as a result of transported sediments and channelization. This process may help us better understand how supraglacial streams will influence the energy balance of the Greenland Ice Sheet in response to climate change. | |
| Chao Li (Department of Ecology, Evolution, and Natural Resources,Rutgers),MingXu(Department of Ecology, Evolution, and Natural Resources,Rutgers) | A Random Forest Approach for Cloud Base Analysis | Different climate models predict different possible futures, the differences in cloud changes are kind of the main reason for that. The temporal and spatial characteristics of cloud base height have an important effect on the evolution of cloud system, its information was obtained by fusion analysis of multi-source observation (i.e. remote sensing data, field cloud base and meteorological observation via various instruments) and numerical model prediction. The core idea of current broadly adopted step-by-step fusion approach is to seek the greatest consistency among multi-source information which arises two problems, first, the consistency rules are difficult to obtain,second, the setting of threshold contains uncertainty and situation depends. Machine learning uses statistical techniques to give computer systems the ability to "learn" from data. Random forests (RF), one of the state of art machine learning algorithms, is an ensemble learning method for classification. RF operates by constructing a multitude of decision trees at training time and outputting the class that is the mode of the classes or mean prediction of the individual trees. In this study,RF was used to integrate various information to establish a data-driven analysis approach (RF-CB) with consideration of physical mechanism.Using the best evaluated data-set from Atmospheric Radiation Measurement (ARM) in the Southern Great Plains (SGP), we establish the RF-CB combing ground observation, satellite radiation data and NCEP prediction.Also, the resulting human readable learning rules and the variable importance measures are studied to deeper understand relationship among various sources of information. | |
| Marie McCrary (Rutgers University), Jim Miller (Rutgers University) | The 2007-2008 Arctic Freshwater Accumulation Event in the Beaufort Gyre | The objective of this study is to examine the characteristics and processes responsible for an unprecedented increase in the liquid freshwater (FW) content and decrease of sea ice in the Beaufort Gyre(BG) during 2007 - 2008, a period of strong anti-cyclonic circulation, where the liquid FW content increased by 3,100 km3 (15%). We analyze in-situ and altimetry observations to investigate the magnitude and timing of the FW accumulation. To identify potential FW sources, we analyze pathways of water originating from the Mackenzie River and Bering Strait during each summer from 1993 to 2013 by launching Lagrangian tracers advected by the velocity fields in the Global Ocean Physics Reanalysis (GLORYS). Additionally, tracer pathways from the five largest Arctic rivers and the Bering Strait are analyzed during cyclonic and anti-cyclonic circulation regimes. We find 2007 was the only year from 1993 to 2012 where FW tracers from the Bering Strait and Mackenzie River moved directly in to the BG moorings, triggering an ice melt event. We provide evidence that the confluence of these two water masses served as a preconditioning event for the 2008, and possibly 2012, sea-ice melt seasons. | |
| Rohi Muthyala (Rutgers University), Asa Rennermalm (Rutgers University), Sasha Leidman (Rutgers University), Matthew Cooper (UCLA), Sarah Cooley (Brown University), Lawrence Smith (UCLA), Dirk As (GEUS) | Towards understanding supraglacial river networks in southwest Greenland | ontributors for sea-level rise and this meltwater is efficiently transported across the surface through supraglacial river networks. However, due to the lack of in situ observations, little is known about the seasonal variation or current models’ ability to simulate discharge from these river networks. In this study, we report and compare two months (22 June – 14 August 2016) of discharge observations with modeled discharge for a ~0.5 km2 supraglacial catchment in the ablation zone of southwest Greenland. Modeled discharge is calculated by a point surface energy balance model forced with meteorological and radiation data from a nearby PROMICE/GAP KAN_L, automated weather station. Model discharge co-varies strongly with in situ discharge, but overestimates the total discharge flow. This model bias is primarily seen over the first half of the melt season and is diminished over the second half of the season, due to the model assumption of neglecting meltwater routing throughout the catchment. The dominant driver of the ice sheet discharge throughout the season is net shortwave radiation. However, during the peak flow events, especially when the shortwave radiation dropped considerably because of overcast conditions, net longwave radiation and turbulent heat fluxes are significant drivers of surface melting and thus meltwater discharge. Therefore, long term supraglacial stream observations such as these are useful in understanding the predominant drivers of surface melt throughout the season. | |
| Ehsan Najafi, Indrani Pal, Reza M. Khanbilvardi | The Space-Time Variation of Global Crop Yields, Detecting Simultaneous Outliers and Identifying the Teleconnections with Climatic Patterns | In this study, we address how the barley yield trends of countries globally were related to each other during the last several decades and the large scale and regional climatic variables that triggered high/low crop yield anomalies simultaneously across the world. Robust Principal Component Analysis (rPCA) is used to identify the primary modes of variation in barley yields. Relations between these modes of variability and anomalous sea surface temperature (SST) and drought using Palmer Drought Severity Index (PDSI), are examined from 1964 to 2010. rPCA is also used to identify simultaneous outliers, i.e. systematic high/low crop yields across the globe. The results demonstrated spatiotemporal patterns of these crop yields and the climate-related events that caused them as well as the connection of outliers with weather extremes. | |
| Allison Neumann (William Paterson University), Chelesia Clarke (William Paterson University), Michael Griffiths (William Paterson University), Martin Becker (William Paterson University), Kenshu Shimada (DePaul University), Sora Kim (University of California, Merced), Harry Maisch IV (William Paterson University), Robert Eagle (University of California, Los Angeles), Drew Pedersen (William Paterson University), Troy Nixon (William Paterson University), Clint Mautz (William Paterson University), Bolaji Agorro (William Paterson University) | The Extinction of Iconic Megatoothed Shark Otodus megalodon: Evidence from Clumped Isotope Thermometry (CIT) | The largest and most iconic fossil shark to have ever lived is Otodus megalodon. Fossil teeth and vertebra indicate this highly successful apex predator achieved lengths up to 20 meters, weights exceeding 20,000 kg, and global distribution throughout the Miocene and Pliocene (23-2.5 MYA). A general consensus indicates that the ability to thermoregulate in O. megalodon acted as a key driver for the evolution of gigantism that impacted its ecological role and success in surviving environmental changes. However, little agreement exists as to the primary cause for the disappearance of O. megalodon where models suggest predator-prey dynamics or environmental change resulted in extinction.To address these alternative extinction hypotheses, ‘clumped’ isotope thermometry (CIT) was tested on modern shark teeth, with known thermoregulatory physiologies, to validate a previously reported calibration equation. Application of this calibration equation to fossils from O. megalodon reveal a much higher body temperature (~50 °C) compared with its smaller and modern equivalent, C. carcharias (~30 °C). We hypothesize O. megalodon would have had to consumed large quantities of prey in order to maintain such a high body temperature. However, cooling of ocean temperatures during the Pliocene would have constrained the species to lower latitudes where ocean temperatures were warmer, whilst its preferred prey (i.e. whales) evolved traits to adapt to cooler temperatures of the higher latitudes (e.g. ‘blubber’). Therefore, large climatic shifts combined with evolutionary limitations may provide the “smoking gun” for the extinction of the largest shark species to ever roam the planet. | |
| Joyce Ong (Rutgers), Jonathan Walter (University of Virginia), Malin Pinsky (Rutgers) | Global hotspots of synchronous marine fisheries | ynchronous population dynamics among marine populations have intrigued scientists for decades and can indicate strong environmental forcing or common predators. Commercially important fisheries that display synchronous patterns are of concern because simultaneous population crashes would likely have negative consequences for coastal fishing communities. Here, we test for the presence of synchronous patterns among marine fish and invertebrate fisheries globally, then examine the underlying mechanisms that may drive these synchronous patterns. We used wavelet analyses, a method suitable for non-stationary data that can identify both time-specific and frequency-specific synchrony patterns. These wavelet methods were used on annually-resolved Food and Agriculture Organization (FAO) fisheries catch data and on large-scale climate data. The FAO catch data consisted of 1092 populations in 15 FAO regions over the period 1950 to 2014. Results show a high degree of synchrony within some FAO regions, particularly the California Current Large Marine Ecosystem (CCLME). In this region, a majority of the 43 species displayed synchronous fisheries catch at periods of 8 to 10-years from the 1970s to 2000s. This periods also corresponds to the North Atlantic Oscillation in winter. Our results suggest that climate variability drives strong synchrony among marine fisheries both globally and in the CCLME. | |
| Aisha Owusu (International Research Institute for Climate and Society - IRI), Madeleine Thomson (IRI), Simon Mison (IRI) | Climate Information for Public Health Action | We live in an increasingly interconnected world. The rapidly increasing movement of people, pathogens, vectors, livestock, food, goods and capital across borders creates both economic opportunities and health risks. Globalization is at the heart of this process, which is both driving, and subject to, accelerating global environmental and climate change. Climate interacts with health through a wide variety of direct and indirect mechanisms. Climate Information for Public Health Action (CIPHA) fills an identified knowledge gap for health policy makers and practitioners (along with climate service providers) in exploring why, when and how climate information can and should be incorporated into health decision-making. Drawing together contributions from a range of key thinkers in the field, this volume will focus on three climate sensitive health outcome areas: infectious disease, hydrometeorological disasters, and nutrition. This book will be a valuable resource for students and academics studying and working in the emerging field of environment and health. | |
| Dhara Patel (Struwe Lab, Rutgers University Department of Ecology, Evolution, and Natural Resources), Jennifer Blake-Mahmud (Struwe Lab, Rutgers University Department of Ecology, Evolution, and Natural Resources), Lena Struwe (Struwe Lab, Rutgers University Department of Ecology, Evolution, and Natural Resources) | Shifting sex ratios and morphology in American Holly | Most plants are hermaphrodites; species with separate sexes, like American Holly, are rare. Because of differences between male and female physiology, dioecious plants face unique circumstances in the face of climate change, which may impact factors such as sex ratios, flowering time, resource utilization, and defense allocation. Using 161 herbarium specimens collected between the years of 1861 and 2016 on record with Rutgers Chrysler Herbarium, we investigated sexual dimorphism and sex ratios in American Holly. When collection numbers permitted, we examined changes in traits over time. We found a significant increase in leaf area for males over time (R2 = 0.115, p < 0.01), a finding that differed from the relationship observed in females. Interestingly, the sex ratio of the herbarium collection became increasingly male-dominated from 1861 to 2000. Contrary to our predictions, we observed no change in defense allocation in holly between sexes over time. We observed no statistically significant change in flowering or fruiting phenology, in contrast to our predictions of earlier flowering and subsequent fruiting. Through our analysis of herbarium specimens, we found that in the New Jersey / Pennsylvania region, changes in flowering and morphology of American Holly have been minimal over the last 151 years. | |
| Ruth Sexton, Sonja Birthisel, and Eric Gallandt (University of Maine) | Impacts of Increasing Precipitation on Physical Weed Control | Farmers in New England who rely on physical weed control (PWC), a practice based on the use of physical tools to control weeds, may see changes in the efficacy of PWC strategies due to climate change. Climate change is expected to increase rainfall and days with extreme precipitation events throughout the year in New England. Increasing precipitation may lead to more days with higher soil moisture, impacting the soil workability necessary for certain tools to be used in the field, as well as the survival of weeds after cultivation. We compared the historical record of days suitable for agricultural fieldwork reported in USDA Crop Progress Reports with the historical record of precipitation in Maine. We found that the number of days per week suitable for fieldwork has decreased over the period 1996-present, coincident with increasing rainfall. We have also conducted a literature review on the effects of soil moisture on PWC and considered how future precipitation trends may impact the feasibility of PWC through field workability. Knowing how rising precipitation will affect PWC may help farmers prioritize equipment and infrastructure investment or otherwise adapt to be more successful. | |
| Asher Siebert (International Research Institute for Climate and Society, Columbia University) | Comparison of the Tercile and Probability Distribution Formats of Seasonal Forecast Information for Climate Services Applications | Historically, seasonal regional Climate Outlook Forums around the world (eg. Greater Horn of Africa, West Africa, Southern Africa, South Asia, Southeast Asia, Caribbean and Latin America) have had a tendency to present their central findings in the format of consensus based maps of tercile probabilities of rainfall and temperature for the coming season. Tools developed at Columbia University's International Research Institute for Climate and Society (IRI) can enable a more refined understanding of the full forecast probability distribution function. This study will explore, in a heuristic way, the advantages and disadvantages of these two approaches from technical and user perspectives, drawing on several examples at the regional level and from Rwanda and Ethiopia. More complex probabilistic information has been developed by IRI staff in interactive online maproom formats.While the tercile approach may convey less information than the full PDF and while it may be easier to arrive at a consensus on tercile forecasts than a full PDF, the tercile approach may over-emphasize the near normal category, may fail to convey some important information about uncertainty and may not have as direct a translation to actionable decisions on the part of the user community as may be the case if the full forecast PDF is disclosed. This being said, there may be additional technical, cost and capacity building challenges to developing robust information on the full forecast probability distribution function and translating those outputs into products that can effectively inform user decisions. | |
| Emily Slesinger (Rutgers University), Alyssa Andres (University of South Florida), Rachael Young (Rutgers University), Brad Seibel (University of South Florida), Vincent Saba (NOAA GFDL), Beth Phelan (NOAA NEFSC), John Rosendale (NOAA NEFSC), Dan Wieczorek (NOAA NEFSC), Grace Saba (Rutgers University) | The effect of ocean warming on black sea bass aerobic scope and hypoxia tolerance | Over the last decade, ocean temperature in the U.S. Northeast Continental Shelf (U.S. NES) has warmed faster than the global average and is associated with observed distribution changes of the northern stock of black sea bass (Centropristis striata). Mechanistic models based on physiological responses to environmental conditions can improve future habitat suitability projections. We measured maximum (MMR), resting (RMR), and hypoxia tolerance (Pcrit) of the northern adult black sea bass stock to assess performance across the known temperature range of the species. A subset of individuals were held at 30˚C for one month (30chronicC) prior to experiments to test acclimation potential. Aerobic scope (MMR-RMR) reached a maximum at 24.4C (AS: 367.21 mgO2 kg-1 hr-1) and the 30chronicC group had a significant decrease in AS. The Metabolic Index, calculated from Pcrit as an estimate of potential aerobic scope, closely matched the measured factorial aerobic scope and declined with increasing temperature to a minimum below 3. This may represent a critical value for the species. Temperature in the U.S. NES is projected to increase above 24C in the southern portion of the northern stock’s range. Therefore, these black sea bass will likely continue to shift north as the ocean continues to warm. | |
| Janice McDonnell (Rutgers University), Carrie Ferraro (Rutgers University), Marissa Staffen (Rutgers University) | Rutgers Climate Change Education: Two Successful Program Models | Education is a critical component in the global response to address climate change. Learning about climate change empowers youth to take action with a local and global reach. The Department of 4-H Youth Development teaches climate change science to New Jersey youth through two model programs. These models include the Climate Change & Environmental Summit and the NJ 4-H Climate Science Education Program. Both programs have evolved over the past decade, engaging hundreds of youth and educators in climate science learning. Our programs are accomplished through collaboration within Rutgers University including; Cooperative Extension and the Departments of Marine and Coastal Sciences, Geography, and Environmental Sciences. Schools and community organizations are also a vital component to successful climate science education programing. This presentation will introduce both programs, offering insight on how to engage the community in climate science education through research-based models. In this poster, we will share our methods, teaching resources, and the outcomes and impacts of these programs. | |
| Samantha M. Staskiewicz (The College of New Jersey), Chris E. Forest (The Pennsylvania State University), Melissa M. Gervais (The Pennsylvania State University) | Can an Interactive Ocean Impact the Indian Ocean-NAO Teleconnection? | We use the Community Earth System Model (CESM) to observe the teleconnection between the sea surface temperature (SST) of the Indian Ocean and the North Atlantic Oscillation (NAO). In this work, we compare results based on simulations using a fixed SST patch in the Indian Ocean with simulations using a slab-ocean model (SOM) within the CESM. In both cases, we examine how these SSTs are positively correlated with the NAO amplitude. For the SOM case, we apply anomalous heat fluxes to the standard Q-flux fields to impose changes in SSTs using the interactive slab-ocean. This method allows atmosphere-ocean heat fluxes to adjust surface temperatures everywhere and feedback on the atmospheric NAO response. To analyze changes in the teleconnections, we estimate changes in both the Indian Ocean and the NAO as related to patterns in SST, sea level pressure (SLP), and precipitation. By understanding how the results of our method compare to the earlier work, we can begin to understand the role of atmosphere-ocean feedback in teleconnection responses. In initial results, we have observed how an interactive ocean reduces the strength of the Indian Ocean-NAO teleconnection. | |
| Jerry Vorbach, P.E., MBA (Green Services, LLC CEO and President) | Global Climate Change: Economic Impacts and Abatement Strategies for Greenhouse Gas Emissions Using the U.S. Environmental Protection Agency's Residential Carbon Footprint Calculator | This presentation will discuss the causes of global climate change by first explaining the greenhouse effect and the analogous effects caused by greenhouse gas emissions from both a chemistry and physics perspective. Next, it will show the correlation between carbon dioxide concentrations and temperature changes over the last more than 400,000 years. Also, the percentage contribution of greenhouse gas emissions by gas, economic sector, country, and continent, as well as the amount of greenhouse gas emissions/person/household will be broken out. Additionally, the economic impacts of greenhouse gas emissions will be delineated, both in the United States and worldwide. Further, worldwide, United States, and individual efforts to reduce greenhouse gas emissions will be detailed. Finally, this presentation will provide details on the U.S. Environmental Protection Agency’s Residential Carbon Footprint Calculator. This Calculator is a Microsoft Excel Workbook tool that identifies the major sources of residential greenhouse gas emissions including electricity, transportation, heating and cooling, major appliances, and solid waste. It also provides the associated tons of carbon dioxide equivalent emissions per year and per person per year for the average American home, as well as average consumption and waste generation for each major source, along with the assumptions for these emissions. | |
| Amy Wang (Rutgers University), Dustin Wang (Rutgers University) | Pathways to Completely Renewable Electricity at Rutgers University | Our modern energy system is an integral component of contemporary society, providing people with the means to work effectively and live comfortably in a fast-paced world. Historically, the least expensive forms of energy production involve fossil fuel combustion, which create greenhouse gas emissions and contribute to anthropogenic climate change. Universities can be a significant leader in mitigating climate change through their energy sources. A Rutgers University transition to 100% renewable energy sources for our electricity would require significant initiative, coordination, and investment. Despite Rutgers’ numerous achievements in sustainability, the University lacks clear direction and goals for the future, indicating insufficient dedication to environmental stewardship as compared to peer institutions of higher education. Through modeling and research, it was determined that a campus-wide transition to 100% renewable electricity from 2018 to 2050 would cost, at most, $517,208,379.92 to invest, operate, and maintain. In comparison, if Rutgers decided to not invest in additional energy infrastructure, the total cost of supplying electricity from the grid to the University during the same time span would be $1,927,667,569.80. A successful transition would require strategic organization and funding assistance. Our overarching recommendation is for Rutgers to set an emissions reductions goal. | |
| Elizabeth Wright-Fairbanks (Rutgers), Grace Saba (Rutgers), Travis Miles (Rutgers), Baoshan Chen (University of Delaware), Wei-Jun Cai (University of Delaware), Kui Wang (University of Delaware), Andrew Bernard (Sea-Bird Scientific), Charles Branham (Sea-Bird Scientific), Clayton Jones (Teledyne Webb Research) | Development of a deep-sea glider pH sensor to monitor coastal acidification | Ocean acidification alters the oceanic carbonate system, resulting in ecological, economic, and cultural losses. Currently, few high-resolution ocean carbonate system measurement tools exist. Traditional acidification monitoring efforts have either low spatial resolution (moorings) or high cost and low temporal resolution (research cruises). To improve acidification monitoring efforts, we modified and integrated a Deep-Sea Ion Sensitive Field Effect Transistor (ISFET) pH sensor into a Slocum G2 profiling ocean glider. The deep ISFET glider sensor is a new, cost-effective technology that can routinely provide high-resolution water column carbonate system data. The pH glider was tested in a 20-day deployment in May 2018. This deployment found higher pH associated with chlorophyll maximums, higher temperatures, and higher salinities. Lower pH occurred in bottom waters and nearshore surface waters following heavy precipitation. Glider-based salinity measurements were used to calculate total alkalinity based on a conservative relationship between the two in the Mid-Atlantic. Together, pH and alkalinity were used to resolve the carbonate system of the deployment region. The technology tested here provides a foundation for the development of a regional acidification monitoring network. | |
| Jing Xiao (Rutgers University), Åsa K. Rennermalm (Rutgers University), Sasha Leidman (Rutgers University), Federico Covi (University of Alaska Fairbanks), Kierin Rogers (Rutgers University), Mike MacFerrin (University of Colorado at Boulder), Regine Hock (University of Alaska Fairbanks), Marco Tedesco (Columbia University) | Firn properties of 8 cores collected in southwestern Greenland Ice Sheet 2018 | Increasing mass loss of Greenland Ice Sheet is the main cause of 21st century global sea level rise. The majority of ice sheet mass loss comes from surface melting. While most meltwater escapes to the ocean in the form of runoff, a substantial fraction infiltrates into firn and refreezes. Ice lenses formed in the firn can prevent meltwater from entering deeper layers causing water to flow into the ocean as surface runoff instead of refreezing. To better understand the spatial variability of firn properties and potential impermeable layers, eight firn cores were drilled at three sites in southwestern Greenland in the spring of 2018. Here, we report on their lengths, weights, ice lens features, and the distribution of these properties. Through this work, we are trying to explore the spatial variability of firn properties and in what way does it relate to the surface runoff. | |
| Jiacan Yuan, Robert E. Kopp, Wenhong, Li, Yi Deng | Subtropical Stationary Waves Connecting Hydrological Extremes To Climate Warming in Boreal Summer | Subtropical stationary waves may act as an important bridge connecting regional hydrological extremes with global warming. Observations show that the boreal summer stationary-wave amplitude (SWA) had a significantly positive trend during 1979–2013. Here, we investigate the past and future responses of SWA to increasing climate forcing using 31 CMIP5 GCMs. Twenty-three out of 31 models display a consistent increase in climatological-mean SWA in response to warming. To assess the detectability of a trend in SWA, we compared half-century trends between preindustrial control (PiControl), historical, and RCP8.5 simulations. The probability distribution of the normalized SWA trend obtained through bootstrapping shows neither positive nor negative tendencies of SWA trend in PiControl simulations. A total of 22 of 31 historical simulations exhibit a positive SWA trend. The SWA trends in 26 of 31 RCP8.5 simulations are positive. The finding supports the hypothesis that the positive SWA trend is at least partially driven by increasing external forcing. The linear regression of interannual variability in hydrological extreme frequency on SWA suggests that high SWA is related to increased heavy-rainfall-day frequency over South Asia, the Indochinese Pen- insula, and southern China (SA-EA), and to increased dry-spell-day frequency over the northwestern and central United States (NUS) and the southern United States and Mexico (SUS-MEX). The projected amplification of SWA, combined with the relationships between SWA and number of hydrological extremes, may partially explain projected increases in the number of dry spells over NUS and SUS-MEX and the number of heavy-rainfall days over SA-EA.` | Poster PDF |


